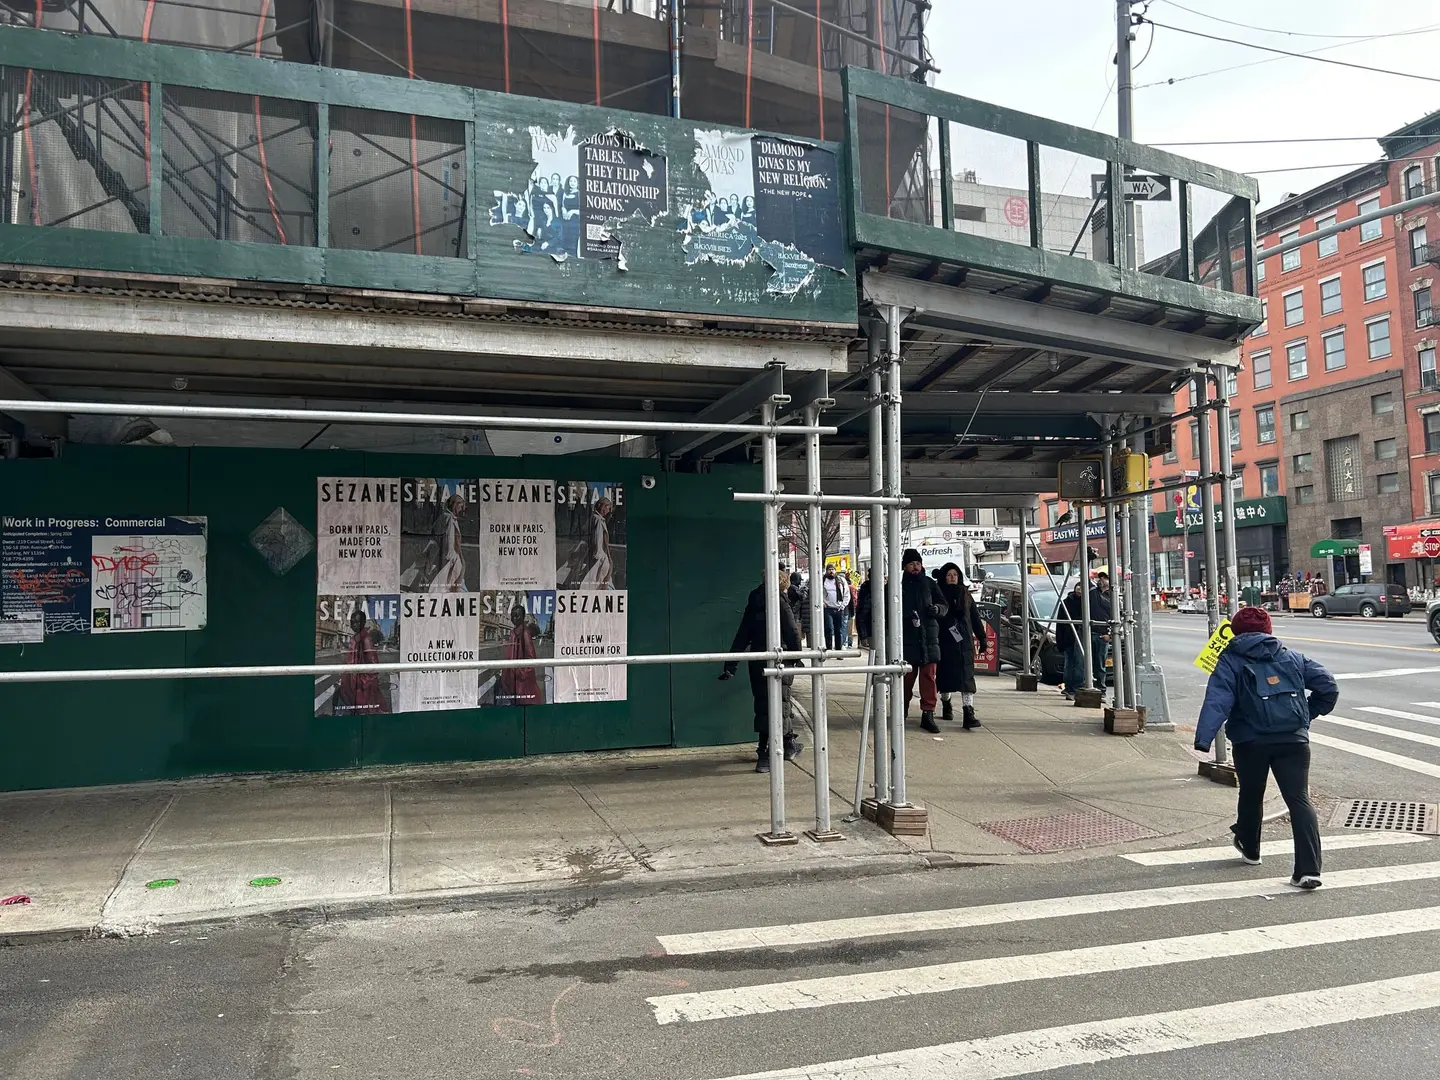
Paid social reports on itself. Every impression and conversion arrives in a dashboard the platform built, counted the way the platform counts. Google is open about this: the attribution model is a setting you choose per conversion action, and the model you pick changes how many conversions land in the column you are judging the campaign by. A wall has no such setting. It sits on a street and gets looked at, and nobody sends you a CSV about it.
That asymmetry is where most street-advertising ROI claims go wrong. An agency that cannot measure clicks will sometimes produce a cost-per-acquisition anyway, built from estimated foot traffic multiplied by an assumed conversion rate. The number looks precise and means nothing. We do not publish those, and you should be skeptical of anyone who does.
Out-of-home does have a real audience-measurement system, and street paper sits outside it. The OAAA describes Geopath’s audience ratings as a standardized, quantitative measurement consistent with other common media metrics, and Geopath builds an impression from a circulation count adjusted by a visibility index, the share of that audience likely to notice the ad, derived from a visibility study of factors such as a unit’s size and its distance from the road. A wheatpasted poster on a construction hoarding carries no such rating, which is why we will not hand you an impression figure for one.
What follows is the comparison we think is defensible: what a street campaign can prove on its own, and what only your analytics can answer.
What the agency can actually prove
The deliverable on our side is evidence that the media ran as sold. For every campaign we ship, each placement is photographed wide and close, with a compliance frame and a GPS stamp, logged against its install date and address. It sounds procedural until you have been billed for a poster run nobody can show you.
The numbers we publish are counts, not outcomes:
| Campaign | Format | Placements | Window |
|---|---|---|---|
| Sézane, NYC and LA | Wheatpaste | 15 across 2 cities | 35 days |
| Huda Beauty, NYC | Printed sidewalk decals | 60 across Manhattan and Brooklyn | 35 days |
| Palantir, San Diego and Honolulu | Wheatpaste | 300 across 2 cities | 5 days |
| RYZE Coffee, NYC | Wheatpaste, 24x36 | 500 across Brooklyn and Manhattan | 21 days |
| Bloom Effects, NYC | Sidewalk stencils | 9 across SoHo, LES, Williamsburg | 28 days |
Those five sit at very different points on the same dial. Bloom Effects bought nine stencils and left them working for four weeks. Palantir bought three hundred posters and wanted the whole run up inside a working week, 250 in San Diego over 48 hours and 50 in Honolulu over 72. Both briefs were correct for what they were doing. Placement count is a decision about saturation, and it is not a quality score.
What only your analytics can answer
Everything downstream of the wall belongs to you. Whether a campaign moved brand search, sent sessions to the site, filled a pop-up, or sold anything is measurable, but it is measurable in your stack and your retail partners’ systems, not in our install log.
The search half of that is not a hopeful assumption about the medium. In a November 2022 survey of 1,461 US adults by the OAAA and Morning Consult, 88% said they notice out-of-home ads, and 51% said they had used a phone to look up more information about the advertiser. That is documented behavior across the category rather than a promise about your campaign, and the only place it can show up for you is your own reporting.
Four metrics are worth the setup effort:
- Brand-search volume in the campaign metro, pulled at the metro or zip level against a pre-install baseline. National numbers bury the signal.
- Direct and organic sessions, segmented to the markets that actually ran.
- Redemptions on a code that exists nowhere else, which is the cleanest signal available on a street buy.
- Organic mentions tagged to placement locations, which works for the formats people stop to photograph: large-format paper and pavement work.
Setting up a comparison that holds
Three things have to be true before the comparison means anything.
Give the street campaign an endpoint it owns. A campaign-specific short domain, or a promo code used nowhere else, with custom campaign parameters on any QR you print so those sessions land in their own row instead of dissolving into direct traffic. Shared endpoints make the two channels indistinguishable, which usually means the channel with the dashboard takes the credit.
Baseline before install. Two to three weeks of the metric you care about, measured in the same geography, so the campaign window reads against something. Retrofitting a baseline afterward is where most street-vs-digital case studies fall apart. The stronger version, if the budget allows it, is the design Jon Vaver and Jim Koehler published at Google in 2011: randomly assign non-overlapping regions to test and control, run the campaign in the test regions only, and read the difference between them. They wrote it up for search spend, and it transfers to a street buy because a street buy is already geographic.
Decide the metric before you price either channel. If the metric is impressions, social is the only one of the two that can produce the number, for the reason above. If the metric is presence across a defined half-mile for a month, the comparison inverts, because buying that geography through an auction means paying for everyone outside it too.
Where each one actually wins
Paid social is the better buy when the audience is dispersed rather than clustered, when creative needs to iterate weekly, when purchase happens in-app, or when the campaign has to be live tomorrow. Street work carries a production and install clock, and once paper is on a wall it cannot be switched off mid-flight.
The street buy earns its place when geography is the targeting: a pop-up on one block, or a conference corridor where your buyers already walk. In those briefs the audience definition is an address, and an auction is a clumsy way to buy an address.
Where the budget covers both, they are not really in competition. Run the street work in the markets that matter with a tracked endpoint on it, and let the social budget carry frequency against the same audience. The wall gives the campaign something physical to point at. The social spend makes sure the people who walked past it see it again.
Getting started
Pull your last four quarters of paid-social CAC by metro before you do anything else. That is the number the street buy has to be compared against, and a national average cannot stand in for it. Then pick one market where the audience is genuinely concentrated, attach a dedicated endpoint, and run a single window with a real baseline behind it.
Published floors are on the pricing page: posters from $3,500, stencils from $2,500, snipes from $3,000, floor graphics from $4,000. Turnaround, size, location count, and format mix move the number, and a quote comes back inside 24 to 48 hours. Nothing here is a performance guarantee, and we do not make them.